
Report No. 6
Week ending 12 February 2010
A print friendly version of this report is available as a PDF (185 KB)Key Indicators
The counting of every case of pandemic influenza is no longer feasible in the PROTECT phase. Influenza activity and severity in the community is instead monitored by the surveillance systems listed below.Is the situation changing? |
Indicated by laboratory confirmed cases reported to NetEpi and/or National Notifiable Diseases Surveillance System (NNDSS); GP Sentinel influenza-like illness (ILI) Surveillance; and emergency department (ED) presentations of ILI at sentinel hospitals (New South Wales and Western Australia). Laboratory data are used to determine the proportion of pandemic (H1N1) 2009 influenza circulating in the community. |
|---|---|
How severe is the disease, and is severity changing? |
Indicated by number of hospitalisations, ICU admissions and deaths from sentinel hospital surveillance as well as emergence of more severe clinical picture in hospitalised cases and ICU admissions. |
Is the virus changing? |
Indicated by emergence of drug resistance or gene drift or shift from laboratory surveillance. |
Top of page
Summary
- As at 12 February 2010, there have been 37,713 confirmed cases of pandemic (H1N1) 2009 and 191 deaths reported in Australia.
- National influenza activity remains low and are at levels experienced at the same time in previous years as measured by:
- ILI presentation rates to General Practitioners;
- ILI presentations to emergency departments (EDs) in New South Wales and Western Australia;
- FluTracking surveillance of ILI;
- Enquiries to the National Health Call Centre Network (NHCCN); and
- Absenteeism rates.
- As at 7 February 2010, the WHO Regional Offices reported at least 15,292 deaths associated with pandemic (H1N1) 2009 worldwide. In Northern Hemisphere, overall pandemic influenza activity continues to decline in most countries. The most active areas of transmission continue to be in later peaking areas, particularly in Northern Africa, South Asia and East Asia.
- Pandemic influenza (H1N1) 2009 virus continues to be the predominant influenza virus circulating worldwide. In addition to the increasing proportion of seasonal influenza type B viruses recently detected in China (accounting for 72% of all influenza detected in the reporting week), low levels of seasonal H3N2 and type B viruses are circulating in parts of Africa, East and Southeast Asia, and are being detected only sporadically on other continents.
- The WHO Collaborating Centre in Melbourne has reported that from 1 January 2010 to 12 February 2010 no isolates have shown resistance to oseltamivir by enzyme inhibition assay (EIA) and two clinical specimens collected in Australia have shown the H275Y mutation known to confer resistance to oseltamivir.
- To date, WHO reported that 245 oseltamivir resistant pandemic (H1N1) 2009 viruses had been detected and characterised worldwide. All of these isolates showed the same H275Y mutation but all were sensitive to zanamivir.
Top of page
1. Influenza activity in Australia
Laboratory Confirmed Cases
There have been 20 new laboratory confirmed pandemic (H1N1) 2009 notifications reported this reporting period.a However, pandemic influenza activity is currently low in Australia. Sporadic cases of pandemic influenza continue to be reported without evidence of sustained community transmission (Figures 1 and 2).There were 37,713 confirmed cases of pandemic (H1N1) 2009 in Australia as of 12 February 2010, including 191 pandemic influenza-associated deaths.
a Please note that this increase in laboratory confirmed pandemic (H1N1) 2009 notifications is due to a backlog in data entry by jurisdictions. Data are subject to change retrospectively as jurisdictions are cleaning and validating their records.
Figure 1. Laboratory confirmed cases of pandemic (H1N1) 2009 in Australia, to 12 February 2010
Source: NetEPI database
Figure 2. Influenza activity in Australia, by reporting week, years 2007, 2008, 2009* and 2010*
* Data on pandemic (H1N1) 2009 cases are extracted from NetEPI; data on seasonal influenza are extracted from NNDSS.
Sources: NNDSS and NetEPI databases
Top of page
Influenza-Like Illness b
Sentinel General Practice SurveillanceCombined data available from the Australian Sentinel Practices Research Network (ASPREN) and the Northern Territory GP surveillance system, up until 7 February 2010, show that nationally, ILI consultation rates remained low and are consistent with levels seen in 2008 and 2009 (Figure 3).
In the last week, the presentation rate to sentinel GPs in Australia was approximately 5 cases per 1,000 patients seen.
Figure 3. Weekly rate of ILI reported from GP ILI surveillance systems from 1 January 2007 to 7 February 2010*
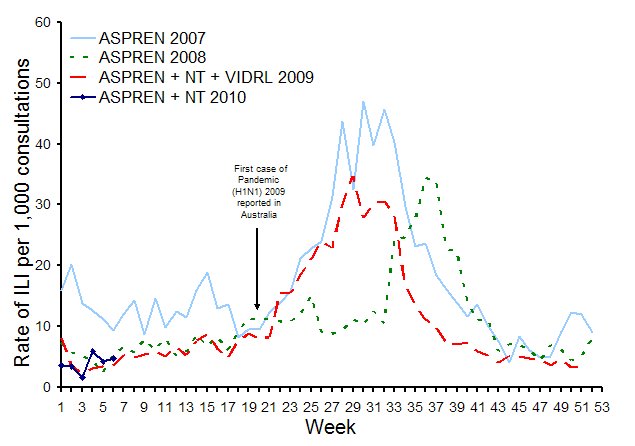
* Delays in the reporting of data may cause data to change retrospectively. As data from the NT surveillance system is combined with ASPREN data for 2010, rates may not be directly comparable across 2007, 2008 and 2009.
Source: ASPREN, and NT GP surveillance system.
Top of page
WA emergency departments
The number of ILI presentations reported in Western Australian EDs decreased in the week ending 7 February 2010 and are at levels seen at the same time in previous years (Figure 4).Figure 4. Number of Emergency Department presentations due to ILI in Western Australia from 1 January 2007* to 7 February 2010 by week
* In early July 2007 (week 26), several deaths associated with influenza infection were reported in children from Western Australia. The public response to these deaths could account for the sudden increase in ILI presentations to Perth EDs in 2007.
Source: WA ‘Virus Watch’ Report
Top of page
NSW emergency departments
In January 2010, there were 95 presentations with influenza –like illness to NSW EDs. This is less than the previous month (December, with 151 presentations), but is greater than the count of 65 for January 2009.Source: NSW Health ‘Influenza Monthly Epidemiology Report1
Top of page
Flutracking
Flutracking, a national online tool for collecting data on ILI in the community, reported that activity remained at low levels both nationally and at the jurisdictional level in the week ending 14 February 2010 (Figure 5).Figure 5. Rate of ILI symptoms and absence from regular duties among Flutracking participants by week (from 3 May 2009 to week ending 14 February 2010)
Source: Flutracking Interim Weekly Report
Top of page
National Health Call Centre Network
The number of ILI related calls received by the NHCCN remained stable, with 29 calls in the week ending 12 February 2010. At the peak of the 2009 season, the NHCCN received approximately 1900 ILI-related calls per week. The number of calls is currently at baseline levels (Figure 6).Figure 6. Number of calls to the NHCCN related to ILI, Australia, 1 January 2009 to 12 February 2010*
*Data in the most recent week are incomplete and will be updated retrospectively.
SOURCE: NHCCN data
Top of page
Deaths associated with influenza and pneumonia
Death registration data show that as at 8 January 2010, there were 101 pneumonia or influenza deaths per 1,000 deaths in NSW, which was lower than previous weeks and was below the seasonal threshold of levels expected at that time of year (Figure 7).Figure 7. Rate of deaths classified as influenza and pneumonia from the NSW Registered Death Certificates, 2005 – 2010
Source: NSW ‘Influenza Monthly Epidemiology Report’
Top of page
Absenteeism
The most recent data indicate that in the first four weeks of 2010 (ending 3 February), national absenteeism rates decreased slightly and were similar to levels seen at the beginning of previous years (Figure 8).Figure 8. Rates of absenteeism (greater than 3 days absent), national employer, from 28 January 2007 to 3 February 2010, by week.
Source: Absenteeism data
Top of page
Sentinel Laboratory Surveillance - confirmed influenza notifications
While limited laboratory data were available for this reporting period, results from sentinel laboratory surveillance systems show only one sample has been confirmed positive for pandemic (H1N1) 2009 (Table 1).Table 1. Laboratory respiratory tests that tested positive for influenza A and pandemic (H1N1) 2009 influenza
| ASPREN* – national | WA | NT (reported by WA NIC) | |
|---|---|---|---|
| Number of specimens tested | 0 |
59 (at 12/2) |
n/a |
| Number tested which were Influenza A | 0 |
1 |
0 |
| Number tested which were pandemic���� (H1N1) 2009 | 0 |
1 |
0 |
*ASPREN tests are collected every Tuesday. Results are reported for a rolling fortnight as data changes retrospectively.
From 2 January 2010 to 12 February 2010, type A was the predominant seasonal influenza type reported by all jurisdictions.
Top of page
2. Overview of pandemic (H1N1) 2009 severity - to 5 February 2010c
While pandemic (H1N1) 2009 is generally considered a mild disease at the community level, it has had serious consequences at the acute end of the disease. Figures of hospitalisations, ICU admissions and deaths are currently used as indicators to provide evidence on the severity of the disease in Australia (Table 2).Pandemic (H1N1) data for 2009 are currently being finalised through cleaning and validation processes. It is possible that these processes will result in some changes in the data presented here. Validated data will be progressively reported as these steps are completed.
Table 2. Summary of severity indicators of pandemic (H1N1) in Australia, to 5 February 2010
| Confirmed pandemic (H1N1) 2009 cases |
Hospitalised cases | ICU cases | Deaths | |
|---|---|---|---|---|
| Total number | 37,693 |
13% (4,992/37,693 confirmed cases) |
14% (681/4,992 hospitalisations) |
191 |
| Crude rate per 100,000 population | 176.3 |
23.4 |
3.2 |
0.9 |
| Median age (years) | 21 |
31 |
44^ |
53^ |
| Females | 51% (19,167/37,693) |
51% (2,528/4,992) |
53% (364/681) |
44% |
| Vulnerable groups (Indigenous persons, pregnant women & individuals with at least 1 co-morbidity) | n/a |
58% (2,892/4,992) |
74% (504/681) |
67% |
| Indigenous people~ | 11% (3,877/34,762) |
20% (810/4,047) |
19% (102/533) |
13% |
| Pregnant women* | n/a |
27% (287/1,056 hospitalised females aged 15-44 years) |
16% (47/287 hospitalised pregnant women) |
4% |
| Cases with at least 1 co-morbidity | n/a |
46% (2,303/4,992) |
67% (457/681) |
62% |
#Data are extracted from a number of sources depending on the availability of information. Figures used in the analysis have been provided in parentheses. Data is not always complete for each summarised figure.
~The denominator for this row is the number of confirmed cases for which Indigenous status is known.
* Includes women in the post-partum period.
^ Validation of data has identified anomalies affecting median ages for ICU cases and deaths in reports #28-33 2009 and report #1 2010. Correction has resulted in a change in the median ages of ICU cases and deaths from report #2, 2010.
Top of page
3. Virology
Antigenic characteristics - WHO Collaborating Centre for Reference & Research on Influenza (WHO CC) in Melbourne
From 1 January 2010 to 12 February 2010, 8 Australian influenza isolates have been subtyped by the WHO CC (Table 3).Table 3. Typing of influenza isolates from the WHO Collaborating Centre, from 1 January 2010 to 12 February 2010
Type/Subtype |
ACT | NSW | NT | Qld | SA | Tas | Vic | WA | TOTAL |
|---|---|---|---|---|---|---|---|---|---|
| A(H1N1) | 0 |
0 |
0 |
0 |
0 |
0 |
0 |
0 |
0 |
| Pandemic (H1N1) 2009 | 0 |
0 |
2 |
0 |
0 |
1 |
5 |
0 |
8 |
| A(H3N2) | 0 |
0 |
0 |
0 |
0 |
0 |
0 |
0 |
0 |
| B | 0 |
0 |
0 |
0 |
0 |
0 |
0 |
0 |
0 |
| Total | 0 |
0 |
2 |
0 |
0 |
1 |
5 |
0 |
8 |
Source: WHO CC
Please note: There may be up to a months delay on reporting of samples.
Isolates tested by the WHO CC are not a random sample of all those in the community, hence proportions of pandemic (H1N1) 2009 to seasonal are not representative of the proportions circulating. Early in the pandemic all influenza A untypeable samples were sent to the WHO CC for testing and later many pandemic (H1N1) 2009 positive samples were sent for confirmation, resulting in biases in the data.
Of the 8 influenza isolates subtyped by the WHO CC one has been antigenically characterized, and confirmed as pandemic A/H1N1 2009 (A/California/7/2009-like).
Top of page
International Updates
The Global Influenza Surveillance Network (GISN) continues to monitor the global circulation of influenza viruses, including pandemic, seasonal and other influenza viruses infecting, or with the potential to infect, humans. Since the beginning of the pandemic on 19 April 2009 to 6 February 2010, 153 countries shared a total of 24,005 specimens (18,557 clinical samples and 5,448 virus isolates) with WHO Collaborating Centres for further characterisation. 1Pandemic (H1N1) 2009 influenza virus continues to be the predominant influenza virus circulating worldwide. In addition to the increasing proportion of seasonal influenza type B viruses recently detected in China (accounting for 72% of all influenza detection in the reporting week), low levels of seasonal H3N2 and type B viruses are circulating in parts of Africa, East and Southeast Asia and are being detected only sporadically on other continents.1
Top of page
Antiviral Resistance
Pandemic (H1N1) 2009
To date, WHO reported that 245 oseltamivir resistant pandemic (H1N1) 2009 viruses had been detected and characterised worldwide. All of these isolates showed the same H275Y mutation but all were sensitive to zanamivir. Of the oseltamivir resistant cases reported to WHO with a known clinical background, 24% were severely immunosuppressed and 23% were associated with treatment.1The WHO CC in Melbourne has reported that from 1 January 2010 to 7 February 2010 no isolates have shown resistance to oseltamivir by enzyme inhibition assay (EIA) and two clinical specimens collected in Australia have shown the H275Y mutation known to confer resistance to oseltamivir (Table 4).
Table 4. Neuraminidase resistance testing of Australian pandemic (H1N1) 2009 influenza viruses
| 2009 | 2010 | |||
|---|---|---|---|---|
| Viral isolates | Clinical specimens | Viral isolates | Clinical specimens | |
| No. tested | 587 |
276 |
0 |
2 |
| EIA Resistant | 4 |
N/A |
0 |
N/A |
| H275Y mutation | N/A |
9 |
N/A |
2 |
Top of page
Seasonal Influenza
The last WHO report on resistance of seasonal influenza strains to oseltamivir was released on 4 June 2009, during the Northern Hemisphere influenza season 2008-2009 and stated that 96% of seasonal influenza A (H1N1) isolates tested from 36 countries worldwide were resistant to oseltamivir.2 Australian oseltamivir resistance testing data on seasonal influenza strains are shown in Table 5.Table 5. Resistance Testing – Seasonal Influenza - Global
Country |
% of H1N1 viruses | % of A(H3N2) | % of B viruses |
|---|---|---|---|
| Australia (since 1 January 2009 and up to 2 December 2009) | 97.2% (36/37) resistant to oseltamivir |
0% (0/40) resistant to oseltamivir |
0% (0/6) resistant to oseltamivir |
Top of page
4. International Influenza Surveillanced
As at 7 February 2010, the WHO Regional Offices reported at least 15,292 deaths associated with pandemic (H1N1) 2009 worldwide. As many countries have stopped counting individual cases, particularly of milder illness, the global case count is likely to be significantly lower than the actual number of cases. 3In Northern Hemisphere, overall pandemic influenza activity continues to decline in most countries. The most active areas of transmission continue to be in later peaking areas, particularly in Northern Africa, South Asia and East Asia. In the Southern Hemisphere, sporadic cases of pandemic influenza continued to be reported without evidence of sustained community transmission. (1)
Top of page
North America
– peak influenza activity occurred during October in Mexico, the United States, and Canada.- In the US during week 5 (up to 6 February 2010), influenza activity remained similar to the previous reporting period. The proportion of outpatient visits for ILI was below the national baseline. Only 4.8% of specimens tested were positive for influenza and all subtyped influenza A viruses reported to CDC were pandemic (H1N1) 2009 influenza viruses.4
- In Canada during week 5 (up to 6 February 2010), all influenza indicators remained low for this time of the year. The national ILI consultations rate was similar to the previous week and is still significantly below the expected range for this time of the year. Only 0.4% of the specimens tested were positive for influenza and the pandemic (H1N1) 2009 strain still accounted for 100% of the positive influenza A subtyped specimens during this reporting period. Only one specimen tested positive for influenza B.5
Top of page
Europe
– During week 5, Bulgaria, Greece and Slovakia reported medium ILI activity. All other countries reported low activity. Of the 910 sentinel samples tested, 8% were positive for influenza A, of which the majority were pandemic (H1N1) 2009 influenza.6- Pandemic influenza activity generally decreased across the UK during week 5 (ending 7 February). The weekly ILI consultation rate decreased in Scotland, increased slightly in Wales and Northern Ireland, and remained stable in England. A decrease in respiratory syncytial virus detections has been observed recently. The main influenza virus circulating in the UK continues to be the pandemic (H1N1) 2009 strain, with few influenza H1 (non-pandemic), H3 and B viruses detected.7
- In Ireland, influenza activity decreased during week 5 (ending 7 February). The sentinel GP ILI consultation rate was 6.8 per 100,000 population during this period, which was similar to the previous reporting period. The highest sentinel GP age-specific ILI consultation rates occurred in the 15-64 year age group. The number of laboratory confirmed cases of pandemic (H1N1) 2009 influenza and related hospitalisations remained stable and no cases were admitted to ICU. Pandemic (H1N1) 2009 influenza was the only influenza virus circulating in week 5.8
5. Data considerations
The information in this report is reliant on the surveillance sources available to the Department of Health and Ageing. As access to sources increase and improve, this report will be refined and additional information will be included.This report aims to increase awareness of pandemic (H1N1) 2009 and seasonal influenza in Australia by providing an analysis of the various surveillance data sources throughout Australia. While every care has been taken in preparing this report, the Commonwealth does not accept liability for any injury or loss or damage arising from the use of, or reliance upon, the content of the report. Delays in the reporting of data may cause data to change retrospectively. For further details about information contained in this report please contact the Influenza Team through flu@health.gov.au
On 17 June 2009 Australia commenced the transition to a new response phase called PROTECT, in which laboratory testing is directed towards people with moderate or severe illness; those more vulnerable to severe illness; and those in institutional settings. This means that the number of confirmed cases does not reflect how many people in the community have acquired pandemic (H1N1) 2009 infection.
NetEpi
All jurisdictions except QLD are reporting pandemic (H1N1) 2009 cases using NetEpi, a web-based outbreak case reporting system. Data from jurisdictional systems are being imported into NetEpi by VIC, NSW, WA, TAS and SA, and the remainder are entering directly into NetEpi. QLD ceased reporting hospitalisations into NetEpi on 6 July 2009.Analyses of Australian cases are based on clinical onset date, if this information is available. Where an onset date is not available, notification date has been used. Victoria uses a calculated onset date which is the earliest available date calculated from specimen date, onset date, notification date or detection date. This assumption was made for all calculations and data on which the figures are based.
National Notifiable Diseases Surveillance System (NNDSS)
NNDSS comprises of notifications from jurisdictions of laboratory-confirmed influenza cases. Laboratory confirmed influenza is notifiable in all jurisdictions in Australia. Confirmed pandemic (H1N1) 2009 cases are being received from all jurisdictions through NNDSS except for Victoria and New South Wales. NSW is also unable to send seasonal influenza notifications data.Data Analysis
Analysis of confirmed influenza cases is conducted on combined NetEpi and NNDSS data. Analysis of morbidity (hospitalisations and ICU admissions) and mortality data is conducted on combined NetEpi and QLD hospitalisation data.Laboratory Surveillance data
Laboratory testing data are extracted from the ‘NSW Influenza Report,’ and the ‘The 2009 Victorian Influenza Vaccine Effectiveness Audit Report’ (VIDRL) ‘South Australian Seasonal Influenza Report’. These reports are provided weekly.WHO Collaborating Centre for Reference & Research on Influenza (WHO CC)
Data are provided weekly to the Surveillance Branch from the WHO CC.Top of page
Sentinel General Practice Surveillance
The Australian Sentinel Practices Research Network (ASPREN) has Sentinel GPs who report influenza-like-illness (ILI) presentation rates in NSW, SA, ACT, VIC, QLD, TAS and WA. As jurisdictions joined ASPREN at different times and the number of GPs reporting has changed over time, the representativeness of ASPREN data in 2009 may be different from that of previous years. ASPREN data are sent to the Surveillance Branch on a weekly basis. Northern Territory GP surveillance data are sent to the Surveillance Branch on a weekly basis. VIDRL influenza surveillance data are sent to the Surveillance Branch on a weekly basis.Sentinel Emergency Department (ED) data
WA - ED surveillance data are extracted from the ‘Virus Watch’ Report. This report is provided weekly. The Western Australia Influenza Surveillance Program collects data from 8 Perth Emergency Departments (EDs).NSW - ED surveillance data are extracted from the ‘Influenza Monthly Epidemiology Report, NSW’. This report is provided monthly. The New South Wales Influenza Surveillance Program collects data from 49 EDs across New South Wales.
Absenteeism
A national organisation provides data on the number of employees who have been on sick leave for a continuous period of more than three days. These data are not influenza or ILI specific and absenteeism may be a result of other illnesses.National Health Call Centre Network
A national organisation provides call centre data for calls relating to ILI or influenza. Data are provided daily and are collated weekly and have been presented in this report to show the pattern of calls to this Call Centre over the 2009 season.FluTracking
FluTracking is a project of the University of Newcastle, the Hunter New England Area Health Service and the Hunter Medical Research Institute. FluTracking is an online health surveillance system to detect epidemics of influenza. It involves participants from around Australia completing a simple online weekly survey, which collects data on the rate of ILI symptoms in communities.Data have been provided weekly and have been presented in this report to show the pattern of self reported ILI in the community over the 2009 season.
Further information on FluTracking is available at www.flutracking.net/index.html
Top of page
6. References
1. WHO Pandemic (H1N1) 2009 - Update 82 & Virological Surveillance Weekly Update. Available from http://www.who.int/csr/don/en/ Accessed 11 January 2010.
2. CDC FluView Weekly report, Week 52 ending 2 January 2010. Available from: http://www.cdc.gov/flu/weekly/ Accessed 11 January 2009.
3. Canada FluWatch Weekly report, weeks 51 & 52 ending 2 January 2010. Available from: http://www.phac-aspc.gc.ca/fluwatch/09-10/index-eng.php Accessed 11 January 2010
4. ECDC daily pandemic update. Available from: http://ecdc.europa.eu/en/healthtopics/Documents/Forms/AllItems.aspx Accessed 11 January 2010.
5. HPA weekly pandemic flu media update week 1, ending 8 January 2010. Available from: http://www.hpa.org.uk/webw/HPAweb&Page&HPAwebAutoListName/Page/1240732817665?p=1240732817665 Accessed 11 January 2010.
6. Influenza Surveillance in Ireland - Weekly Update. Influenza weeks 52 and 53, ending 3 January. Available from: http://www.ndsc.ie/hpsc/A-Z/Respiratory/Influenza/SeasonalInfluenza/InfluenzaSurveillanceReports/20092010Season/File,4101,en.pdf Accessed 11 January 2010.